Analyzing Features Associated with Churn
Customer churn, the percentage of customers that stop using your product or service in a particular time period, can quickly become disastrous to your revenue. Acquiring new customers is more costly than keeping existing ones and even a reasonable sounding churn rate can result in a leaky bucket that is impossible to fill.
Churn is usually measured as:
- subscription churn = the percentage of customers lost
- gross revenue churn = the percentage of revenue lost
- net revenue churn = the percentage of revenue lost offset by up-sells
Net revenue churn is interesting in particular since it can be negative if you sell more in up-sells then you lose in leaving customers. In this article we'll look at trying to understand the factors associated with churn rather than calculating a specific type of churn.
In order to reduce churn we need to:
- measure it and understand it's factors
- understand our customers and their needs
- create innovative ways to address the underlying issues
The Dataset
To study churn and its factors we'll use a commonly used IBM Telco Customer Churn dataset. This particular dataset has 21 variables (columns) such as contract type, services purchased, billing method, and general demographics. There are 7043 observations (rows). Of the 7043 observations 1869 (~26.5%) are labeled Yes for Churn. For more information on the data review the available studies. Your business and data will of course be different but this should serve to illustrate the point.
The traditional task is to develop a model to predict if a customer will churn. This is usually done by taking the dataset with known outcomes and splitting it into a training set and a test set. The training set and known outcomes are then used to build a model which is tested on the test set. During testing the model does not get to see the true churn values from the test set. Instead we keep them aside and use them to compare, analyze and evaluate the predictions from the model.
An important question is how we choose to measure success or performance for our model. The first thing that comes to mind is accuracy. But note that a simple approach, sometimes called the dummy classifier, could just predict Churn No all the time and be ~74% accurate since most customers do not churn. If a model has true predictive power it would need to do better than that baseline. And of course since churn may be caused by other factors not included in the data (someone moving) no model could be 100% accurate. However, we'll use accuracy for now since it is easy to understand but we'll discuss this more later. When analyzing your real world data the metric will require much more careful thought.
Training a Model
For this example we'll use simple XGBoost classifier with the default settings which increases our accuracy to ~80%. Note that this 6% improvement in accuracy is actually a 25% percent improvement in the error which can really impact the bottom line. We may be able to improve the results with hyper-parameter tuning and other data science techniques to build out a more sophisticated model. For now we'll use this simple model and focus on what it tells us about the customers and what factors are related to churn.
The first thing to look at is the feature importance's for the model. These are the features that the model found important during training to improve its performance. The top 5 features are:
0.320 Contract
0.125 TechSupport
0.113 OnlineSecurity
0.061 tenure
0.060 InternetService
Note that the first feature (Contract) is approximately twice as important as the second (TechSupport) and almost three times as important as the third feature OnlineSecurity.
Now this brings up several questions including?
- Are features used during training the most impactful during prediction?
- In which direction do the features affect churn?
- Is this global effect the same for everyone?
- What can we do about it?
Are features used during training the most impactful during prediction?
A powerful way to analyze feature importance during prediction is to take all of your data and change one feature at a time and see how it impacts predictions. This is commonly known as permutation importance.
Doing this we get the top 5 features at prediction time as:
0.044 tenure
0.032 Contract
0.027 MonthlyCharges
0.012 OnlineSecurity
0.011 TotalCharges
These are a little different so we should think about why that is. On further inspection we realize that tenure, contract and total charges are closely correlated. That is, someone who has been a customer for a long time has paid a lot of total charges. And someone who has been a customer for a long time is likely not on a month to month contract and is less likely to churn.
Those three features cause a big change in the prediction which is why they show up in the permutation analysis but they may be so correlated that only one of them is needed. A good question now is are all three needed and if not which is cheaper, more accurate, or otherwise better for the business to use going forward?
In which direction do the features affect churn?
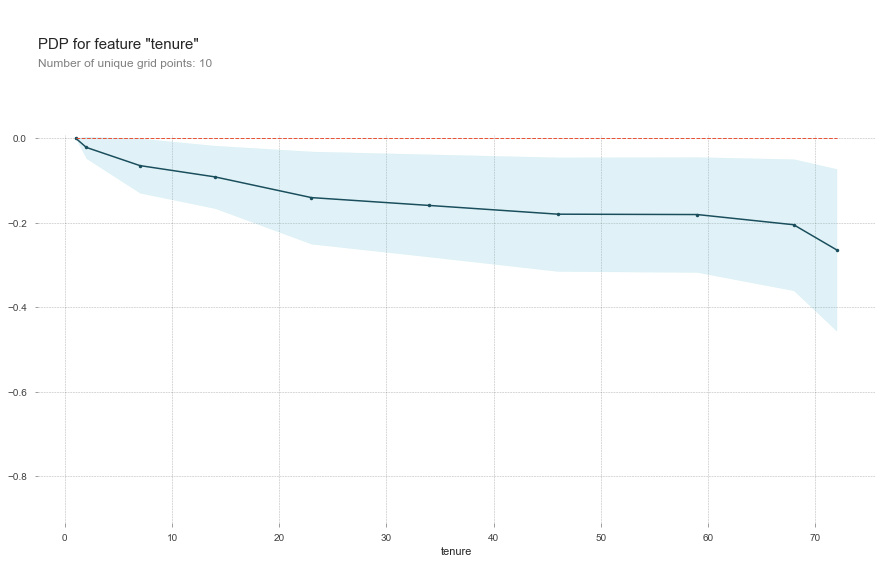
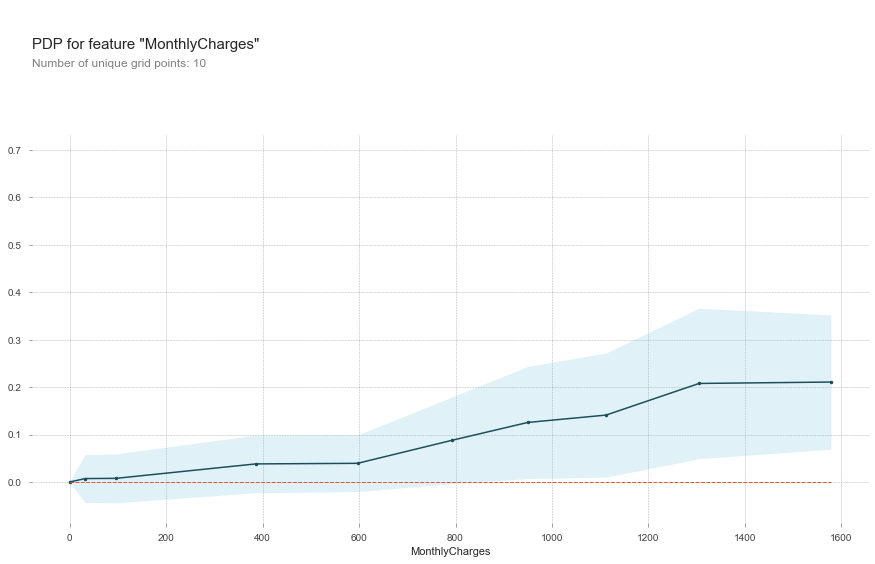
To see how a feature affects churn we can turn to a partial dependence plot (PDP). Similar to the permutation analysis we isolate one feature, run through all the samples with various values of the feature and see how that affects the predictions. It is a kind of what if scenario testing. What if this user was an on a different kind of contract. Or what if we were talking about a new customer or long term customer. How would that affect the prediction?

We see in the chart that tendency to churn drops as tenure increases. Quickly at first and then slowing going down after about 20 months.

Looking at the PDP chart for MonthlyCharges we see that customers paying more per month are more likely to churn. Not good news as those are likely our most profitable customers and would show up as even higher gross revenue churn.
Is this global effect the same for everyone?
Now we might want to know if all the features have the same weight for everyone's predictions. To answer that we can isolate one particular record and go through all the possible features one by one and examine how changes in that feature affect the prediction.
For example here are the main factors that the model thought were important for two different people the model was highly confident would churn that did churn.


We see that in the first case Tenure, Contract and TotalCharges (in that order) were the most important factors in predicting churn. And in the second case MonthlyCharges becomes the primary factor.
An interesting next step would be to group customers we predict will churn based on the important factors for their individual predictions. These groups could then be examined by a domain expert and group specific treatments could be created to address their specific reason to likely churn.
What can we do about it?
This model is nice and all in theory but what can we do about it? Well, that is where it gets tricky. It depends on your business, your dataset, what caused it to be how it is, which factors you can and want to address and what the cost of that intervention would be.
In this example, tenure and total charges are important predictors and probably related but not something we can easily do something about. That is you can't force people to stay a customer longer in an effort to make the stay longer. Having a month to month contract is similar in that we can't force people onto a long term contract but perhaps we can do something to encourage them. That of course seems obvious but it is worth further investigation.
Another major factor is MonthlyCharges but we don't know why MonthlyCharges are important. Perhaps it is pure dollar amount. Perhaps it is dissatisfaction with the quality of the services signed up for. Perhaps there was a big marketing campaign to sign customers up for a lot of services they didn't really want or need. Then these new customers churn after the trial period is over. There a lot of questions but this gives a place to start looking for answers.
Of course it is important to keep in mind that these factors are all correlated with churn but correlation is not causation. This is all to say that when using predictive modeling it is important to have a clear business use case and to understand the goals and costs associated with each scenario and to think hard about what the data is revealing.
If you have questions or if there is anyway I can help, please do not hesitate to get in touch.