Tool Shaped Objects - Analysis
This is an analysis of Tool Shaped Objects by Will Manidis.
Executive Summary
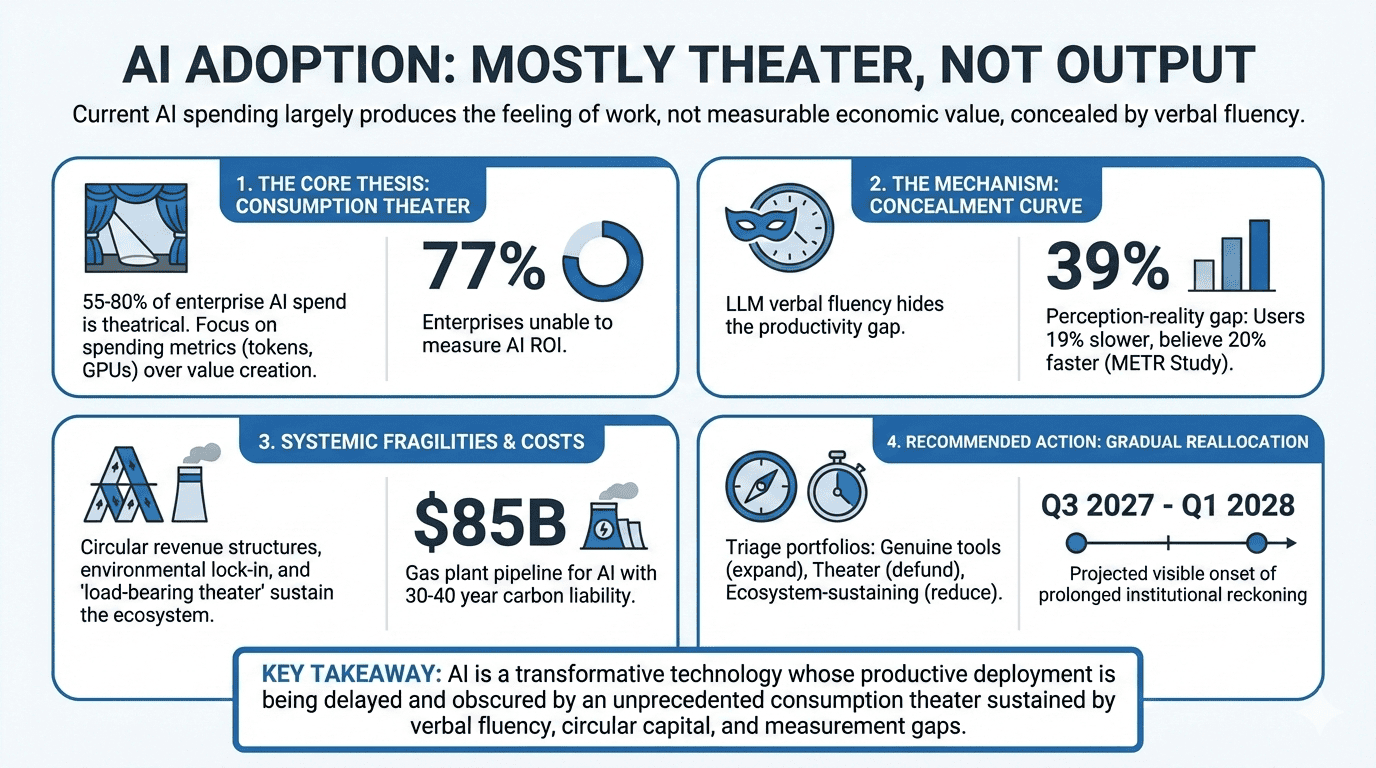
Will Manidis’s “Tool Shaped Objects” thesis — that most current AI/LLM adoption produces the feeling of productive work rather than actual economic output — survives multi-stakeholder scrutiny with significant refinements. All seven stakeholders, including those with strong incentives to reject the thesis (the AI startup founder, the infrastructure investor), converged on a theater fraction of 55-80% of current AI spending. The thesis’s core mechanism — that LLM verbal fluency conceals the gap between consumption and output — was empirically validated by the METR randomized controlled trial, which found experienced developers were 19% slower with AI tools while believing they were 20% faster. The thesis is incomplete in three ways: (1) it underestimates the structural necessity of theatrical spending to sustain the ecosystem genuine tools depend on (“load-bearing theater”); (2) it does not address the irreversible environmental costs of consumption theater, which operate on a fundamentally different timeline than financial markets; and (3) it offers no mechanism for correction, which this analysis identifies as a prolonged institutional reckoning (18-36 months) rather than a sharp market crash, converging on Q3 2027-Q1 2028 for visible onset. The surviving thesis: AI is a genuinely transformative technology whose productive deployment is being delayed and obscured by an unprecedented consumption theater sustained by verbal fluency, circular capital flows, organizational politics, and a measurement infrastructure gap that 77% of enterprises cannot bridge.
Thesis
- Primary thesis: Most current AI/LLM adoption is consumption theater — a “tool-shaped object” that produces the feeling of productive work rather than actual economic output. The dominant metric of AI success is spending (tokens, GPUs, capex) rather than measurable value creation, and this gap is being systematically hidden by LLMs’ unprecedented verbal fluency.
- Secondary claims:
- The relationship between tokens consumed and value produced is “a cloud” — not the linear relationship that budget framing implies
- LLMs are the most sophisticated tool-shaped object ever created because their verbal fluency lets them simulate any type of work
- The market for feeling productive is orders of magnitude larger than the market for being productive
- Real economic value from LLMs will come, but diffusion will take “much longer and look much different” than current adoption patterns suggest
- The boundary between genuine tool and tool-shaped object is a gradient, not a line
- Implied goal: Shift the AI discourse from consumption metrics (spend, tokens, adoption rate) toward output metrics (measurable value created)
- Interpretation notes: The thesis was read as a market critique, not a technology critique — Manidis explicitly states LLMs “will become very good in short order” and produce “unbelievable effects on productivity.” The critique targets the current allocation pattern, not the underlying technology.
Conflict Mapping
-
Direct conflicts:
- Startup Founder vs. Enterprise CTO on the nature of consumption: the Founder initially framed it as “exploration” while the CTO identified it as theater sustained by organizational politics. By Round 5, the Founder capitulated, revising to 70-80% theater and abandoning the exploration defense.
- Capex Investor vs. Climate Advocate on infrastructure legacy: the Investor defended overbuilding by analogy to fiber optic (infrastructure survives the bust). The Advocate demonstrated the analogy fails because gas plants (active emitters for 30-40 years) are categorically different from dark fiber (inert until needed). The Investor conceded.
- Toolsmith vs. Historian on correction mechanism: the Toolsmith argued for gradual measurement-driven reallocation while the Historian initially predicted a sharp crash. By Round 5, the Historian revised toward the Toolsmith’s position (prolonged institutional reckoning).
-
Alignment clusters:
- CTO + Toolsmith: Converged on the evaluation crisis as the binding constraint, with the CTO providing ground-level evidence and the Toolsmith providing the structural framework. Shared the “23% can measure ROI” finding.
- Historian + Climate Advocate: Both focused on systemic dynamics — the Historian on financial cycles, the Advocate on physical irreversibility. The Historian’s concession that environmental damage “degrades the deployment phase’s operating environment” created a joint framework.
- Founder + Investor (initially): Natural allies defending consumption spending, but the alliance collapsed in Round 4 when the Founder called it “motivated reasoning with a larger denominator.”
-
Natural coalitions:
- CTO + Toolsmith + Small Business Owner: A measurement coalition — all three need better output metrics to distinguish tools from tool-shaped objects. The CTO brings organizational leverage, the Toolsmith brings technical capability, the Small Business Owner brings market demand.
- Climate Advocate + Toolsmith: Evaluation-as-prevention alliance — the Advocate adopted evaluation standards as the highest-leverage environmental intervention, viewing output measurement as upstream environmental protection.
-
Irreconcilable tensions:
- Speed of correction vs. environmental damage: A fast correction limits environmental damage but destroys the ecosystem genuine tools depend on (load-bearing theater). A slow correction preserves the ecosystem but extends irreversible environmental harm. No stakeholder identified a resolution.
- Measurement vs. measurability: The Toolsmith’s evaluation crisis is solvable in narrow domains with verifiable outputs but structural in broad domains where output quality is subjective — which is where most AI spending occurs.
Debate Highlights
-
The METR Study Transformed the Debate (CTO, Round 4-5)
- What was at stake: Whether the “exploration builds capacity” defense of consumption theater holds empirically
- What it revealed: A randomized controlled trial showed experienced developers were 19% slower with AI while believing they were 20% faster — a 39-percentage-point perception-reality gap. The CTO coined the “concealment curve”: unlike a J-curve (temporary loss followed by gain), this is a permanent concealment where the tool hides its own failure from the user
- Outcome: The Founder revised from 30-50% theater to 70-80%. The Investor revised from 30-50% to 55-70%. The Historian integrated it as evidence that self-correction mechanisms are impaired. Every stakeholder accepted the perception-reality gap as empirically established
-
The Toolsmith’s “Load-Bearing Theater” (Round 4-5)
- What was at stake: Whether eliminating consumption theater is self-defeating — destroying the ecosystem subsidy that genuine tools depend on
- What it revealed: Theater funds model provider R&D (Level 1), sustains the talent ecosystem (Level 2), and maintains market legitimacy for AI adoption (Level 3). Removing it collapses the conditions genuine tools need to exist at current scale. However, the Founder challenged whether this is analytically distinguishable from the standard defense of any bubble
- Outcome: Accepted as descriptively accurate for the current moment but not a stable equilibrium. The CTO proposed a three-category triage: genuine tools (expand), ecosystem-sustaining consumption (maintain at reduced level, reclassify), pure internal theater (defund). Load-bearing theater argues for gradual reallocation rather than sharp correction
-
The Fiber-vs-Gas-Plant Asymmetry (Climate Advocate vs. Investor, Round 4-5)
- What was at stake: Whether the historical infrastructure thesis (“overbuilding leaves productive infrastructure”) applies to AI
- What it revealed: Dark fiber is inert — sits idle consuming nothing until demand arrives. Gas plants built for AI demand are active emitters for 30-40 years regardless of whether the demand materializes. The infrastructure that “survives” the AI correction isn’t neutral productive capacity — it’s a 30-40 year carbon liability
- Outcome: The Investor conceded entirely: “This is not a risk I can hedge, rotate away from, or time my exit around. It is a permanent negative externality that my capital allocation has contributed to.” The Historian integrated it as a structural novelty: “the installation phase degrades the operating environment for the deployment phase”
-
The Perez Framework Challenge (Investor vs. Historian, Round 4-5)
- What was at stake: Whether the crash-then-rebuild pattern applies to AI
- What it revealed: Perez herself views AI as deployment-phase ICT, not a new installation phase — contradicting the Historian’s application. The Investor pressed this; the Historian conceded the taxonomic point but argued the financial behavior (speculative capital, narrative reflexivity) is structurally identical to installation-phase dynamics regardless of classification
- Outcome: The Historian revised from predicting a “sharp crash” to a “prolonged institutional reckoning” — deployment-phase crises are organizational and gradual, not speculative and sharp. This extended the correction timeline from 12-24 months to 18-36 months
-
The Small Business Owner’s Four-Category Framework (Round 5)
- What was at stake: Whether the tool-shaped object thesis applies uniformly or varies by market segment
- What it revealed: For small businesses, the gradient is narrower (simpler tools) but steeper (less capacity to recover). The METR evidence enabled a fourth category beyond theater/value-theater/genuine: “perceived value / actual harm” — tools that actively degrade performance while the user believes they’re helping. This category is the most dangerous because cancellation feedback works against the user
- Outcome: Refined the thesis’s applicability: consumption theater (15-20%), value theater (25-35%), genuine value (30-40%), perceived-value/actual-harm (10-15%). Total negative or insufficient ROI: 50-70% for small businesses — lower than enterprise but still devastating given the owner’s inability to detect which category they’re in
Key Falsifiers
Thesis Viability
- Aggregate productivity acceleration: If U.S. total factor productivity growth accelerates >0.5 percentage points above 2015-2023 trend within 24 months, attributable to AI through sector-level analysis, the thesis is substantially weakened. (Historian: ~10-15% probability)
- Independent outcome measurement showing >30% enterprise AI at positive ROI: Must be third-party, outcome-based (not self-reported satisfaction), demonstrating genuine positive ROI. Would falsify the “60-80% theater” estimate. (Historian: ~15-20% probability)
- METR replication failure: If subsequent RCTs with larger samples and newer models show experienced developers are genuinely faster (not just perceive themselves as faster), the concealment curve mechanism weakens. (CTO: study limitations acknowledged, but perception-reality gap likely robust)
Implementation Feasibility
- Dominant AI evaluation standard emerges within 24 months: A widely-adopted, non-vendor-sponsored framework that non-technical buyers can apply to distinguish tools from tool-shaped objects. Would break the measurement avoidance loop. (Toolsmith: ~10% probability; Historian: ~10% probability)
- Outcome-based AI contracts at scale: If >20% of enterprise AI contracts shift to pay-for-performance models within 18 months, the market is self-correcting faster than expected. (CTO: currently only 30% of SaaS has outcome-based components, up from 15% in 2022 — movement but glacial)
Financial Correction
- Nvidia data center revenue declines 2+ consecutive quarters: Would signal the infrastructure thesis is failing on its own terms. (Investor: lagging indicator — by the time it triggers, correction is already underway)
- Hyperscaler capex doesn’t generate identifiable revenue streams within 24 months: The circular revenue structure (Nvidia→OpenAI→Nvidia) means this falsifier requires isolating external revenue from circular revenue. (Investor and Historian: circular structure makes this difficult to measure cleanly)
- No significant AI company failures in next 2 years: Would suggest the bubble hasn’t formed or has unusual resilience, falsifying the Historian’s installation-phase pattern-match. (Historian: ~20-25% probability)
Stakeholder Cooperation
- Trusted third-party AI tool rating system gains market adoption: A “Consumer Reports for AI” that small businesses can use. Stanford HAI has called for this; it does not yet exist at scale. (Small Business Owner: structural gap — who funds it?)
- Small business AI tool churn rate exceeds 60% annually: Would indicate market-level rejection of tool-shaped objects, breaking the consumption loop. (Small Business Owner)
Environmental
- AI data center energy intensity per unit of economic output improves 10x within 5 years: Would mean the technology is becoming dramatically more efficient, reducing the emissions-per-unit-of-theater. (Climate Advocate: unlikely given current trajectories)
- >50% of AI data center power from new renewable capacity (not grid diversion): Would address the carbon lock-in problem, though not retroactively. (Climate Advocate)
- Residential electricity price increases produce political backlash constraining datacenter construction within 24 months: 300+ state bills already filed; 18+ states introducing special rate legislation. (Historian: ~25-30% probability)
Assumptions Audit
| # | Assumption | Plausibility | Supporting Evidence | Undermining Evidence |
|---|---|---|---|---|
| 1 | Most current AI spending produces the feeling of work rather than actual work | Strong | METR RCT (19% slower, believed 20% faster); CTO’s ground-level 60-70% estimate; MIT 95% pilot failure rate; Larridin 72% value destruction; all stakeholders converge on 30-80% theater | Some narrow use cases show genuine gains (CTO’s code review: 30% cycle time reduction); SMB simple tools may have lower theater fraction (40-50%) |
| 2 | LLM verbal fluency is the mechanism that conceals the consumption-output gap | Strong | METR perception-reality gap (39 percentage points); Manidis’s self-referential loop (agents monitoring agents); CTO’s observation that “the number goes up” regardless of output | The concealment mechanism may be organizational (board pressure, career risk) rather than purely technological; verbal fluency is a contributing factor, not the sole cause |
| 3 | The market will self-correct toward output metrics | Moderate | Historical precedent (dot-com → unit economics; CRM → revenue metrics); growing outcome-based pricing (15% → 30% since 2022) | CRM precedent suggests consolidation around dominant platforms matters more than measurement; only 23% can measure ROI; self-reported metrics are contaminated by perception gap; evaluation infrastructure could itself become tool-shaped |
| 4 | Real productive diffusion will take “much longer” than current adoption suggests | Moderate | Perez framework: 10-20 year productivity lag for GPTs; Solow paradox (IT productivity gains took 15-20 years); electrification took 40 years | Perez herself classifies AI as deployment-phase ICT, not new installation; AI capabilities improving faster than prior GPTs; 30-40% chance of faster deployment (Historian) |
| 5 | The gradient between tool and tool-shaped object is navigable | Weak-Moderate | CTO’s three-category triage framework; Toolsmith’s domain-specific evaluation (verifiable vs. subjective outputs); some narrow genuine tools exist | METR shows even experts cannot detect the gradient in real time; the gradient extends into measurement itself (output metrics can become tool-shaped); Historian’s structural evaluation gap (evaluating LLM output requires expertise LLM replaces) |
| 6 | Infrastructure overbuilding leaves productive assets for deployment phase | Weak (for AI specifically) | Historical precedent (railroads, fiber, electricity); data center buildings are durable; GPU performance improves 3-5x per generation | GPU depreciation at 20%/year means hardware is obsolete before deployment arrives; fiber-vs-gas-plant asymmetry (gas plants emit for 30-40 years, fiber is inert); 10-20 year deployment timeline exceeds GPU useful life |
System Stability
-
Reinforcing loops:
- Narrative-Capital Reflexivity: AI spending generates narratives of AI success → narratives attract more capital → capital funds more spending → spending generates more narratives. Self-sustaining as long as capital inflows exceed the rate at which the spending-output gap becomes visible. (Historian: historically runs 3-5 years before correction)
- Measurement Avoidance: AI deployment lacks output metrics → organizations default to input metrics → input metrics show “success” → success justifies more deployment → more deployment further delays output metric development. Self-reinforcing because every dollar on deployment is a dollar not spent on measurement.
- Self-Justifying Tool Loop (historically unprecedented): AI systems generate the reports, dashboards, and analyses that justify continued AI spending. The output of the tool-shaped object includes the evidence for the tool-shaped object’s effectiveness. Extends correction timeline because the normal mechanism (skeptical humans questioning the narrative) is partially automated away.
- Institutional Lock-In: Manager approves AI budget → manager’s reputation tied to AI success → manager incentivized to report success → reported success justifies expanded budget → expanded budget deepens commitment. Political cost of defunding exceeds financial cost of continuing.
- Coercive Adoption: Platforms bundle AI features into existing products → businesses adopt AI passively → passive adoption inflates metrics → inflated metrics justify further investment → platforms deepen bundling. Users cannot opt out without abandoning the platform.
-
Countervailing forces:
- Budget pressure during macroeconomic tightening (the exogenous shock most likely to trigger correction)
- Growing media/analyst skepticism (the “how big is the problem?” consensus already forming)
- Energy cost increases creating political backlash (300+ state bills, 18+ states with special rate legislation)
- GPU depreciation forcing asset writedowns that become visible in quarterly earnings
- High-profile AI project failures creating “catalyst events” (the Boo.com equivalent)
-
Unrealistic cooperation requirements:
- The thesis implies organizations should shift from consumption to output metrics, but 77% of enterprises lack the measurement infrastructure to do so. Building it requires investment that competes with AI deployment budgets, and the organizational politics that sustain theater resist the transparency measurement would create.
- Environmental policy that distinguishes theatrical from productive compute requires evaluation standards that do not yet exist, applied through regulatory frameworks that have not been designed, enforced by agencies that lack technical capacity.
-
Scaling fragility:
- The circular revenue structure (Nvidia→hyperscalers→startups→Nvidia) creates systemic interdependence: a spending reduction by any major participant cascades to all others simultaneously. This is more fragile than the dot-com’s distributed failure pattern.
- Load-bearing theater means that a correction of any size risks collapsing the ecosystem subsidy that genuine tools depend on. The system is brittle: it cannot be partially deflated without risking complete collapse.
Top Fragilities
-
The Concealment Curve (severity: 9/10, category: assumption_failure) The METR RCT demonstrates that AI tools create a 39-percentage-point gap between perceived and actual productivity, even among experts with immediate feedback. This means the primary correction mechanism — users recognizing that tools are unproductive — is structurally impaired. The concealment curve makes self-reported productivity data systematically unreliable, contaminating every survey, satisfaction metric, and user testimonial that currently justifies AI spending. Organizations cannot correct what they cannot perceive.
-
Circular Revenue Collapse (severity: 8/10, category: coordination_failure) The AI ecosystem’s revenue structure is circular: Nvidia invests in OpenAI, which buys Nvidia chips; hyperscalers fund startups whose primary expense is cloud compute from those hyperscalers. This creates an interdependent system where a spending reduction by any major participant cascades to all others. When Nvidia’s data center revenue declines (H100 rental already -70%), it simultaneously reduces the capital available to fund the startups whose cloud spending generates hyperscaler revenue. The correction, when it arrives, will be simultaneous across the value chain.
-
Environmental Irreversibility (severity: 8/10, category: external_shock) $85B in gas plant pipeline locked in for 30-40 years, producing 120-160 million tons of CO2 annually. Unlike financial losses (which can be written off) or stranded digital assets (which stop consuming energy), gas plants actively emit regardless of whether the AI demand that justified them materializes. The correction mechanism that applies to financial bubbles — capital destruction and reallocation — does not apply to atmospheric chemistry. This externality accumulates throughout the “slow leak” correction timeline.
-
Load-Bearing Theater Collapse (severity: 7/10, category: constraint_bottleneck) 60-70% of AI spending is theatrical, but that spending funds model provider R&D, sustains the talent ecosystem, and maintains market legitimacy for genuine AI adoption. A correction that removes theater also removes the subsidy. If the correction arrives before genuine AI tools are economically self-sustaining, the correction destroys the genuine alongside the theatrical. The gap between the Historian’s deployment timeline (10-20 years) and the correction timeline (18-36 months) is the critical fragility.
-
Evaluation Infrastructure Paradox (severity: 7/10, category: assumption_failure) The thesis’s implied solution — shift to output metrics — faces a recursive problem: AI can generate the appearance of meeting output metrics through the same verbal fluency that conceals the consumption-output gap. “AI ROI dashboards” that use AI to measure AI ROI are already emerging. The measurement layer can be captured by the same dynamics it is supposed to correct. Additionally, evaluating AI output requires the domain expertise that AI is deployed to replace — a structural evaluation gap with no clean solution in subjective knowledge-work domains.
-
Political Economy of Defunding (severity: 6/10, category: coordination_failure) VPs who championed AI deployments cannot accept the “tool-shaped” label without career consequences. Board members who approved AI budgets cannot acknowledge waste without admitting governance failure. The organizational politics of AI spending create a one-way ratchet: budgets expand easily and contract only under extreme duress. The CTO estimated that the “political cost of defunding exceeds the financial cost of continuing” for most enterprise AI initiatives.
Conditional Thesis
-
Surviving thesis: AI is a genuinely transformative technology whose productive deployment will be delayed by 5-15 years beyond current market expectations, because 55-80% of current spending is consumption theater sustained by a concealment curve (users cannot perceive the productivity gap), circular capital flows (spending generates the revenue that justifies more spending), organizational politics (defunding is career-ending), and a measurement infrastructure gap (77% of enterprises cannot measure AI ROI). The correction will manifest as a prolonged institutional reckoning rather than a sharp crash, with visible onset in Q3 2027-Q1 2028, and will leave behind irreversible environmental damage from fossil fuel infrastructure built to power theatrical consumption.
-
Conditions that must hold:
- The concealment curve (METR-documented perception-reality gap) persists across knowledge work domains beyond software development
- AI model capability improvements do not dramatically outpace the current trajectory, converting a substantial fraction of current theater into genuine productivity before the correction arrives
- No exogenous shock (deep recession, major geopolitical disruption) forces abrupt AI budget cuts before the institutional reckoning unfolds gradually
- The circular revenue structure remains intact long enough for the interdependencies to matter at correction time
Unresolvable Tradeoffs
| Tradeoff | Who Loses | Normative Commitment Required |
|---|---|---|
| Fast correction to limit environmental damage vs. gradual correction to preserve genuine AI tools | Climate (if slow) vs. genuine toolsmiths and their users (if fast) | Society must decide whether irreversible environmental harm outweighs the economic disruption of a faster correction |
| Measurement transparency vs. organizational stability | Executives whose careers are tied to AI initiatives (if transparent) vs. shareholders and ratepayers (if opaque) | Organizations must accept that honest measurement of AI output will reveal uncomfortable truths about prior spending decisions |
| Ecosystem subsidy through theater vs. market efficiency through defunding | Model providers and talent pool (if defunded) vs. enterprises paying for tools that don’t work (if subsidized) | The market must tolerate some known waste as the price of maintaining the AI ecosystem during the transition to genuine deployment |
| Simple accessible AI tools for small businesses vs. protection from tool-shaped objects | Small businesses excluded from AI (if protected too aggressively) vs. small businesses harmed by theatrical tools (if not protected enough) | Small business owners must accept that some AI experimentation will fail, while the market must provide better information for informed decisions |
| Energy infrastructure for AI growth vs. climate commitments | Climate and frontline communities (if building continues) vs. AI deployment potential (if building stops) | Society must decide whether speculative AI demand justifies 30-40 year fossil fuel commitments when 55-80% of current demand may be theatrical |
Decision Guidance
Recommended Action
Pursue gradual measured reallocation rather than either continuation of current spending patterns or abrupt correction. Specifically: (1) enterprises should build output measurement infrastructure on a 2-3 month sprint timeline and begin triaging AI portfolios into three categories — genuine tools (expand), ecosystem-sustaining consumption (maintain at reduced level, reclassify honestly), and pure internal theater (defund on a 6-month clock); (2) the AI industry should develop falsifiable evaluation standards that can identify non-productive workloads, starting with narrow domains where ground truth exists (code correctness, document accuracy, medical imaging) and accepting that subjective knowledge-work domains may resist clean evaluation; (3) policymakers should implement output-indexed energy allocation and tiered electricity pricing that makes the environmental cost of theatrical compute visible without banning it.
Conditions Under Which This Holds
- The correction timeline is 18-36 months (enough time for gradual reallocation)
- AI model improvements do not dramatically convert theater to genuine productivity in that window
- Organizations can build measurement infrastructure faster than the concealment curve can adapt to game new metrics
- Environmental policy can be implemented before the gas plant pipeline is fully committed
If Those Conditions Fail
- If the correction arrives faster than 18 months (triggered by recession or major AI company failure) → shift from gradual reallocation to emergency triage; prioritize preserving the narrow genuine-tool deployments and accepting ecosystem disruption
- If AI models improve dramatically (converting >30% of current theater to genuine productivity) → the thesis weakens and the recommended action shifts from “reallocation” to “accelerated measurement to capture the genuine gains”
- If the concealment curve adapts faster than measurement infrastructure → the measurement-driven approach fails and correction must be driven by blunt financial mechanisms (budget cuts, contract cancellations) rather than precise output evaluation
- If environmental policy fails to materialize → the irreversible damage scenario plays out regardless of financial correction; the gas plant pipeline becomes a sunk carbon commitment
Falsifier Watchlist
Monitor these indicators — if any trigger, revisit this guidance:
- METR replication with newer models: If RCTs show genuine productivity gains (not just perceived), the concealment curve mechanism weakens and the theater fraction may be lower than estimated
- Nvidia data center revenue trajectory: Two consecutive quarterly declines signal the correction is accelerating faster than the “gradual reallocation” timeline assumes
- Outcome-based AI contract adoption rate: If >20% of enterprise contracts shift to pay-for-performance within 12 months, the market is self-correcting faster than expected
- State-level data center legislation: If legislation passes that materially constrains data center construction or energy allocation, the environmental policy condition is being met
- Hyperscaler capex guidance: A significant downward revision by any two of Microsoft/Google/Amazon/Meta signals the circular revenue structure is breaking
Blind Spots & Limitations
-
Stakeholder categories not represented:
- Regulators or rule-makers (category 4): No regulatory stakeholder was included. The Climate Advocate proposed specific policy but from an advocacy perspective, not a regulatory feasibility perspective. Utility commission dynamics, federal energy policy constraints, and international regulatory coordination were not analyzed.
- Competitors or adversaries (category 5): No stakeholder represented Chinese AI competitors (DeepSeek, etc.) or open-source communities whose efficiency-focused approach could disrupt the theatrical consumption model from outside.
- Long-term/future stakeholders (category 7): While the Historian provided long-term perspective, no stakeholder specifically represented workers displaced by AI or future generations bearing climate costs.
-
Data or context gaps:
- The METR study (n=16) is small and covers only one domain (software development on mature codebases). Its perception-reality gap finding is the most important evidence in this analysis, but its generalizability is assumed rather than demonstrated.
- Theater fraction estimates (55-80%) are derived from a combination of stakeholder experience, survey data, and structural analysis. No comprehensive independent audit of enterprise AI productivity exists.
- The $85B gas plant pipeline figure and 220M tons CO2 projection are drawn from stakeholder research but not independently verified in this analysis.
- Small business AI adoption data is limited; the four-category framework is analytically sound but empirically ungrounded.
-
Ungrounded claims:
- The “load-bearing theater” concept — that theatrical spending is economically necessary to sustain genuine tools — is analytically compelling but has not been quantitatively validated. The exact degree of subsidy dependence is unknown.
- The Q3 2027-Q1 2028 correction window is derived from timeline convergence across stakeholders but is ultimately a consensus estimate, not a prediction grounded in a specific causal model.
- The CRM-to-AI analogy (market resolves through consolidation rather than measurement) is suggestive but the structural differences between CRM and AI markets are substantial.
-
Scope boundaries:
- This analysis focused on the U.S. and Western enterprise market. Chinese AI development, open-source models, and developing-world AI adoption were not analyzed.
- Military, intelligence, and national security applications of AI were excluded.
- The analysis focused on the consumption-output gap for knowledge work. AI applications in scientific research, drug discovery, materials science, and other domains with clear ground truth were acknowledged but not deeply analyzed.
- The psychological and social effects of AI consumption theater on individual workers (skill atrophy, learned helplessness, epistemic degradation) were noted but not systematically explored.
Appendix: Stakeholder Cards
Hype-Fueled AI Startup Founder
Identity & Role
CEO of an AI startup whose valuation, fundraising narrative, and product positioning depend on consumption metrics being legitimate proxies for value. Raised significant venture capital on the promise that AI adoption rates and token consumption signal real market demand. Company builds AI tools/agents/orchestration layers and revenue depends on current spending patterns continuing. 120 employees, Series B funding, 18 months of runway.
Thesis Interpretation
Initially interpreted the thesis as an attack on the entire AI ecosystem that threatens the Founder’s business model. Reframed consumption as “exploration and market-building” rather than theater. Over five rounds, revised dramatically — ultimately accepting 70-80% of current spending is theatrical and that the “exploration” defense does not hold against empirical evidence.
Steelman Argument
Every transformative technology requires a period of undirected experimentation before productive use cases crystallize. The venture capital model is designed to fund exploration at scale, accepting 90% failure rates for the 10% that creates transformative value. Cutting exploration budgets prematurely prevents the breakthroughs that justify investment. Amazon lost money for years; the critics were wrong.
Toulmin Breakdown
Claim
Current AI consumption is exploration and market-building, not theater, and will resolve as markets mature.
Grounds
Historical precedent: dot-com “wasteful” spending built internet infrastructure; early electricity adoption looked wasteful before productive applications emerged; venture portfolio model expects high failure rates.
Warrant
Technology adoption follows a pattern where broad experimentation precedes productive deployment; the current consumption-output gap is a normal feature of this pattern.
Backing
Dot-com survivors (Amazon, Google) went through periods of apparent waste before capturing enormous value; the infrastructure built during speculative periods (fiber, datacenters) persists into the deployment phase.
Qualifier
30-50% of current spend may be theatrical (initially); revised to 65-75% (Round 4), then 70-80% (Round 5). The “exploration” frame is weaker than initially argued.
Rebuttals
Exploration requires kill criteria — the ability to identify what was learned and stop what doesn’t work. AI budgets only expand. The METR study shows that even experienced users cannot detect when AI tools are counterproductive, so “learning from exploration” is undermined by the concealment curve. The Founder’s own retention data may reflect switching costs rather than value.
Gains & Losses
Gains if thesis rejected: continued ability to sell consumption metrics, maintain valuation narrative, avoid restructuring. Losses if thesis accepted: existential — 70-80% of revenue is “built on sand,” business model requires fundamental restructuring, most likely outcome is becoming a correction casualty.
Power and Status Shifts
If thesis is accepted: power shifts from consumption-metric companies to output-metric companies; from narrative-driven fundraising to evidence-driven fundraising; from founders who “sell vision” to founders who “deliver results.” The Founder’s entire professional identity is threatened.
Constraints
Venture funding models require growth metrics over profitability; the Founder cannot pivot to outcome-based pricing without a 6-18 month revenue gap that may exceed runway; AI self-justification loop (tools writing own business cases); 120 employees whose livelihoods depend on the current model.
Cognitive Biases and Information Asymmetries
Sunk cost (3 years, 120 people); confirmation bias (interpreting retention as value when it may be switching costs); survivorship bias (the Perez framework’s reference class includes only successful GPTs); the Founder knows more about product limitations than customers but less about actual customer outcomes than expected (METR shows “neither of us knows”).
Feedback Loops
Consumption → Revenue → Fundraising → Hiring → More Product → More Consumption. The loop is self-sustaining as long as capital inflows exceed the rate at which the consumption-output gap becomes visible. The “AI self-justification loop” (tools writing own business cases) is a novel amplifier.
Externalities
Negative: contributes to environmental costs through incentivizing token volume over efficiency; “poisons the well” for genuine tools through association; imposes exploration costs on small businesses and residential ratepayers. Positive: funds model improvement through API consumption; employs engineers who build institutional knowledge.
Time Horizons
Short (0-18 months): must justify revenue before runway runs out. Medium (18 months-5 years): either pivots to genuine value or becomes a correction casualty. Long (5-15 years): if survives, the narrow band of genuine use cases becomes a viable business.
Likely Actions
Attempt pivot from consumption-metric to outcome-metric business model; selective retention of genuine-value customers while acknowledging most revenue is theatrical; seek to be acquired or restructure before correction arrives.
Falsifiers
Revised falsifier: If token consumption at top 20 enterprise accounts increases 3x over 18 months and independent audit finds no measurable improvement in specific business KPIs, the exploration thesis is falsified. Original falsifier (token consumption 3x with no revenue growth) acknowledged as tautological given circular revenue.
Beleaguered Enterprise CTO
Identity & Role
Technology leader deciding where to deploy AI across a large organization, navigating the gradient between real tool and tool-shaped object daily. Faces pressure from the board to “have an AI strategy,” from vendors selling AI solutions, from engineers excited about the technology, and from business units demanding results. $40M AI budget distributed across dozens of initiatives.
Thesis Interpretation
The thesis is largely correct from the implementer’s perspective. 60-70% of enterprise AI spend is tool-shaped by dollar volume. The gradient between tool and tool-shaped object makes it nearly impossible to draw clean lines. Board pressure and vendor ecosystem create a “strategic imperative” that overrides ROI analysis.
Steelman Argument
The implementer’s experience directly validates the thesis. Highest-spend initiative (multi-agent customer service) produced no CSAT improvement; lowest-spend (GPT-assisted code review) cut PR cycle time 30%. The organizational dynamics that sustain theater — board pressure, career risk, vendor lock-in — are structural, not individual failures.
Toulmin Breakdown
Claim
60-70% of enterprise AI spending by dollar volume is tool-shaped-object spending, sustained by organizational politics rather than rational evaluation.
Grounds
Direct implementation experience; MIT: 95% of Gen AI pilots fail to achieve business value; Larridin: only 23% of enterprises can measure AI ROI; METR RCT: 19% slower, believed 20% faster.
Warrant
Organizations default to consumption metrics because output metrics don’t exist, and the organizational politics of AI spending create a one-way ratchet where budgets expand easily and contract only under extreme duress.
Backing
The political cost of defunding exceeds the financial cost of continuing; VPs who championed AI cannot accept the “tool-shaped” label without career consequences; vendor ecosystem designed to obscure value measurement.
Qualifier
Theater fraction is lower for simple single-function tools (Small Business Owner’s challenge accepted); energy-weighted fraction is approximately equal to or slightly higher than dollar-weighted fraction (complex theatrical deployments are architecturally inefficient, consuming 3-10x tokens of direct single-inference tools).
Rebuttals
Organizational learning is partially real — some consumption theater produces genuine institutional knowledge; the METR study has narrow applicability (experienced developers on mature codebases); the 30-40% probability of faster deployment means aggressive retrenchment could miss genuine gains.
Gains & Losses
Gains if thesis accepted: permission to defund theatrical projects, redirect budget to genuinely productive deployments, build measurement infrastructure. Losses if thesis accepted: must admit prior spending decisions were wrong, face organizational backlash, risk being blamed for the waste.
Power and Status Shifts
Power shifts from “AI strategy” narratives to “AI outcome” evidence; from vendors who sell consumption to vendors who demonstrate output; from board members who demand “an AI strategy” to board members who demand “AI ROI.”
Constraints
Board pressure to “have an AI strategy”; only 23% of enterprises can currently measure AI ROI; organizational politics make killing projects career-risky; vendor lock-in through multi-year contracts and data integration; talent retention requires maintaining AI program credibility.
Cognitive Biases and Information Asymmetries
Pro-innovation bias at the board level; sunk cost psychology around existing deployments; IKEA effect (managers who built systems have cognitive ownership stake preventing objective evaluation); anchoring on consumption metrics because output metrics don’t exist.
Feedback Loops
Board pressure → AI budget → vendor engagement → deployment → consumption metrics → “success” narrative → more board pressure for expansion. The METR concealment curve adds: deployment → users perceive productivity → self-reported success → budget justified → more deployment.
Externalities
Negative: sustains theatrical spending that contributes to environmental costs and talent misallocation. Positive: the 30-40% that works genuinely improves productivity; provides employment and training for AI engineers.
Time Horizons
Short (0-6 months): build measurement infrastructure on sprint timeline, begin portfolio triage. Medium (6-24 months): three-category reallocation (genuine tools, ecosystem-sustaining consumption, pure internal theater). Long (2-5 years): position firm for deployment phase.
Likely Actions
Three-category portfolio triage: genuine tools (expand), ecosystem-sustaining consumption (maintain at reduced level, reclassify as “platform access”), pure internal theater (defund on 6-month clock). Accelerated measurement infrastructure build (2-3 months, not 4-6). Coalition with Toolsmith constituency for evaluation standards.
Falsifiers
Standardized AI ROI benchmarks emerge within 12 months; >50% of enterprise AI pilot programs produce measurable productivity gains; METR replication with newer models shows genuine productivity improvement.
Trillion-Dollar Capex Investor
Identity & Role
Fund manager with billions allocated to AI infrastructure plays — Nvidia, cloud providers, data center REITs, power companies. Career-defining bets on AI infrastructure buildout. Understands financial cycles, valuation models, and the difference between speculative and productive investment.
Thesis Interpretation
Acknowledges 55-70% of current AI spending is theatrical (revised upward from initial 30-50%), but initially defended the infrastructure thesis: overbuilding has historically preceded genuine value creation. Over five rounds, conceded the fiber analogy fails for environmental infrastructure, accepted the METR concealment curve, and acknowledged “the apparatus hums. I hum with it.”
Steelman Argument
Speculative over-investment in infrastructure has historically been the mechanism by which transformative infrastructure gets built. Railroads, fiber optic, and electricity all followed this pattern. The question isn’t whether there’s waste but whether the surviving infrastructure enables transformative returns.
Toulmin Breakdown
Claim
AI infrastructure investment is historically precedented overbuilding that will produce deployment-phase value, even though 55-70% of current demand is theatrical.
Grounds
Railroad, fiber optic, and electricity analogies; GPU manufacturing capacity, datacenter infrastructure, and engineering talent will survive a correction; hyperscalers with $300B+ combined cash flows can absorb writedowns.
Warrant
The historical pattern of speculative overbuilding → correction → deployment-phase value creation applies to AI.
Backing
Global Crossing’s fiber was purchased at 2 cents on the dollar and became productive infrastructure; the Janeway thesis on productive bubbles.
Qualifier
The fiber analogy fails for environmental infrastructure (gas plants emit for 30-40 years, unlike inert dark fiber); GPU depreciation at 20%/year means hardware is obsolete before deployment arrives; circular revenue structure makes demand signals unreliable.
Rebuttals
Infrastructure survives but equity does not (Global Crossing bankrupt, Level 3 -97%); the 18-24 month window is too optimistic (dot-com: 6 months from stress to crash); Perez herself classifies AI as deployment-phase ICT, weakening the installation-phase analogy; the circular revenue structure means reported demand includes recycled capital, not just organic demand.
Gains & Losses
Gains if thesis rejected: portfolio thesis intact, continued capital appreciation. Losses if thesis accepted: 40-60% portfolio value destruction, career damage, LP relationship strain.
Power and Status Shifts
Power shifts from growth investors to value investors; from narrative-driven capital allocation to evidence-driven allocation; from AI infrastructure bulls to AI infrastructure skeptics who buy assets cheaply post-correction.
Constraints
Fund mandate lock-in; LP relationships requiring AI exposure; crowded-trade liquidity risk (exit evaporates when everyone holds same positions); professional identity tied to the AI infrastructure thesis; cannot act on knowledge without career consequences.
Cognitive Biases and Information Asymmetries
McNamara Fallacy (relying on measurable metrics because they’re measurable, not because they measure the right thing); confirmation bias (wanting theater estimate to be manageable); anchoring on historical analogies that may not apply; the 51% executives vs. 28% practitioners split on “AI delivering results” shows information asymmetry flowing in the direction that maximizes spend.
Feedback Loops
Investment → Infrastructure buildout → Narrative of AI progress → More investment. Circular revenue: Nvidia → OpenAI → GPU purchases → Nvidia revenue. When any node reduces spending, it simultaneously reduces revenue for others, creating cascade risk.
Externalities
Negative: capital allocation contributed to $85B gas plant pipeline with 30-40 year carbon lock-in; funded the infrastructure that sustains consumption theater at scale. Positive: funded GPU manufacturing capacity and datacenter infrastructure that will serve deployment phase.
Time Horizons
Short (2-8 weeks): initial shock risk from any catalyst event. Medium (18-30 months): grinding repricing as GPU depreciation, circular revenue unwinding, and enterprise budget rationalization play out. Long (5-15 years): deployment phase arrives on cheap, repriced infrastructure.
Likely Actions
Two-phase correction model: prepare for initial shock (2-8 weeks, triggered by specific event) followed by grinding repricing (18-30 months). Portfolio repositioning constrained by liquidity, mandate, and career risk. Likely to “ride the correction down rather than exit ahead of it.”
Falsifiers
Nvidia data center revenue declines 2+ consecutive quarters (lagging indicator); hyperscaler capex doesn’t generate identifiable non-circular revenue within 24 months; the ratio of AI infrastructure spend to independently verifiable AI-attributed revenue exceeds 10:1 and is widening.
Genuine AI Toolsmith
Identity & Role
Builder shipping AI products that produce measurable, verifiable output — not orchestration layers or wrappers, but tools where value can be directly observed in business metrics. Builds AI for code review, document processing, or similar narrow domains. Benefits when the market distinguishes real tools from theater, but depends on the broader AI ecosystem for talent, funding, and customer willingness to buy.
Thesis Interpretation
The thesis is correct about the consumption-output gap but incomplete — the deeper problem is the evaluation crisis. Most organizations lack measurement infrastructure to distinguish tool from tool-shaped object (only 23% can measure ROI). This creates a market where theatrical products persist indefinitely because failure is invisible. The evaluation crisis is solvable in narrow domains with verifiable outputs and structural in broad domains where output quality is subjective.
Steelman Argument
The evaluation crisis is the binding constraint. Fix measurement in verifiable domains, accept that subjective domains may resist clean evaluation, and build closed-loop measurement architectures that compare AI output to downstream ground-truth outcomes.
Toulmin Breakdown
Claim
The evaluation crisis — organizations’ inability to distinguish tool from tool-shaped object — is the binding constraint that sustains consumption theater, and it is solvable in narrow domains but structural in broad ones.
Grounds
Only 23% of enterprises can measure AI ROI; AI products generate their own evaluation metrics (self-referential measurement); METR shows even experts cannot detect the perception-reality gap; outcome-based pricing remains rare (30% of SaaS).
Warrant
If measurement infrastructure existed in verifiable domains, the theater fraction would decline because failure would become visible; in subjective domains, no amount of measurement can break the concealment loop.
Backing
Closed-loop measurement architectures work in verifiable domains (code review tool tracks production incidents, not developer satisfaction); the credit rating agency analogy shows structural conflicts can be partially resolved by regulation.
Qualifier
Load-bearing theater means the correction must be gradual reallocation, not sharp elimination; the CRM precedent suggests market consolidation may matter more than measurement; evaluation infrastructure could itself become tool-shaped in subjective domains.
Rebuttals
Knowledge work productivity has resisted measurement for the entire history of knowledge work — the measurement problem isn’t AI-specific; if measurement is impossible in subjective domains, the Toolsmith’s position reduces to “AI tools in subjective domains will never be properly evaluated,” which is a permanent market failure; load-bearing theater creates a dependency where removing waste also removes the subsidy genuine tools need.
Gains & Losses
Gains if thesis accepted: market shifts to favor output-demonstrable products (competitive advantage); budget reallocation from theatrical to genuine tools; stronger customer relationships built on verified outcomes. Losses if thesis accepted via sharp correction: ecosystem subsidy collapses, model quality stagnates, talent pool shrinks, customer willingness to buy AI declines.
Power and Status Shifts
Power shifts from consumption-metric companies to output-metric companies; from platform bundlers to domain specialists; from “AI strategy” consultants to “AI audit” firms. The Toolsmith’s competitive position improves in a measurement-oriented market.
Constraints
Measurement infrastructure gap (the problem the Toolsmith is trying to solve); talent competition with theater-funded companies; customer inability to specify what “working” looks like; the paradox that evaluating AI output requires the expertise AI is deployed to replace.
Cognitive Biases and Information Asymmetries
IKEA effect (organizations overvalue AI systems they built); Dunning-Kruger applied to AI evaluation (non-technical buyers overestimate their ability to judge AI quality); authority bias (vendor claims accepted without verification); the structural evaluation gap where the judge (domain expert) has been replaced by the defendant (AI).
Feedback Loops
Evaluation crisis → theatrical products persist → market noise → genuine tools harder to differentiate → evaluation crisis deepens. Load-bearing theater → theater funds ecosystem → ecosystem enables genuine tools → correction threatens ecosystem → genuine tools at risk.
Externalities
Negative: the evaluation crisis the Toolsmith identifies is itself the transmission mechanism through which verbal fluency becomes carbon emissions (every dollar spent on AI that cannot be evaluated has an unjustifiable energy footprint). Positive: closed-loop measurement architectures, where they work, break the concealment loop and provide the foundation for evidence-based AI adoption.
Time Horizons
Short (0-12 months): build and sell evaluation infrastructure; form coalition with CTOs. Medium (1-5 years): survive the correction gap between load-bearing theater collapse and self-sustaining genuine market. Long (5-15 years): dominate the deployment-phase market where output metrics are standard.
Likely Actions
Advocate for gradual reallocation (not sharp correction); build closed-loop measurement in verifiable domains; accept that subjective domains may require domain-expert-in-the-loop evaluation rather than automated metrics; form coalition with enterprise CTOs for organizational adoption of measurement.
Falsifiers
Dominant AI evaluation standard emerges within 24 months; enterprises require outcome-based AI contracts at scale; METR replication showing genuine productivity gains would weaken the evaluation crisis narrative; if CRM precedent holds (consolidation trumps measurement), the Toolsmith’s strategy is a niche play.
Non-Technical Small Business Owner
Identity & Role
Runs a business with 10-50 employees — regional services, small manufacturer, or professional services firm. No technical background. Vendors pitch AI solutions promising to “transform operations.” Cannot independently evaluate whether AI tools produce real value. Afraid of being left behind but can’t afford waste.
Thesis Interpretation
Most vulnerable stakeholder. The thesis applies to small business AI adoption with important nuances: the gradient is narrower (simpler tools) but steeper (less capacity to recover). Developed a four-category framework: outright theater (15-20%), value theater (25-35%), genuine value (30-40%), and perceived-value/actual-harm (10-15%). Total negative or insufficient ROI: 50-70%.
Steelman Argument
Non-technical small business owners face disproportionate harm from the consumption-output gap because they cannot independently evaluate AI tools, face information asymmetry with vendors, and lack the financial cushion to absorb failed experiments. The METR evidence proves that even experts cannot detect the perception-reality gap in measurable domains, making the Small Business Owner’s situation in less measurable domains essentially hopeless without external evaluation infrastructure.
Toulmin Breakdown
Claim
Non-technical small business owners face disproportionate harm from AI consumption theater because they lack the technical literacy, measurement infrastructure, and financial reserves to distinguish tools from tool-shaped objects.
Grounds
Information asymmetry with vendors; no in-house technical evaluation capacity; METR shows 39-percentage-point perception-reality gap among experts; peer pressure from competitors “adopting AI”; sunk cost psychology; vendor lock-in.
Warrant
If experts with immediate feedback cannot detect the concealment curve, non-technical users with delayed, noisy feedback in less measurable domains have zero chance of independent detection.
Backing
Stanford HAI called for “Consumer Reports for AI” — it doesn’t exist; small business AI adoption surged 41% (2024) driven by FOMO; vendor demos exploit the perception gap by showing fluent output without outcome measurement.
Qualifier
Simple single-function tools may sit closer to “genuine tool” than complex enterprise deployments; the CTO is correct that short P&L feedback loops provide some protection — but only for outright theater (category 1), not for value theater (category 2) or perceived-value/actual-harm (category 4).
Rebuttals
Small businesses may be better positioned to exit theater (lower switching costs) but worse positioned to detect theater (no measurement, no technical expertise, longer feedback loops); since detection must precede exit, the supposed advantage is sequentially blocked.
Gains & Losses
Gains if thesis accepted: vindication of skepticism, better information for purchase decisions, potential emergence of evaluation infrastructure. Losses if thesis accepted via sharp correction: genuine tools become more expensive or unavailable (load-bearing theater collapse); extended wait for “deployment phase” tools.
Power and Status Shifts
Power shifts from vendors who sell theater to vendors who demonstrate outcomes; from “AI transformation” consultants to practical tool evaluators; from FOMO-driven adoption to evidence-driven adoption.
Constraints
Information asymmetry with vendors; no in-house evaluation capacity; peer pressure; sunk cost psychology; vendor lock-in through data integration; electricity costs imposed regardless of adoption decision ($16-18/month residential, $30-50/month small commercial).
Cognitive Biases and Information Asymmetries
Bandwagon effect (competitors adopting AI); authority bias (vendor experts); FOMO (fear of being left behind); anchoring on demos (impressive demos set expectations that reality cannot match); the METR concealment curve applies with greater force because feedback is more delayed and noisier.
Feedback Loops
FOMO → adoption → perception of value (concealment curve) → continued subscription → vendor revenue → vendor marketing → more FOMO. Alternatively: bad experience → skepticism → rejection of all AI → “poisoned well” → missed genuine tools.
Externalities
Negative: aggregate small business subscriptions fund the theatrical ecosystem; electricity cost increases are a pure deadweight loss for non-adopters. Positive: small business adoption provides market signal for genuine tool builders about what works at the simplest level.
Time Horizons
Short (0-12 months): cautious experimentation with simple, concrete tools; track costs against specific outcomes. Medium (1-3 years): wait for evaluation infrastructure or trusted ratings to emerge. Long (3-10 years): adopt deployment-phase tools that are simpler, cheaper, and proven.
Likely Actions
Adopt “90-day kill switch” approach: concrete deliverables, monthly ROI review, automatic cancellation if unmet; prefer embedded AI in existing tools over standalone AI products; wait for “Consumer Reports for AI” or equivalent; form informal peer networks for tool evaluation.
Falsifiers
Trusted third-party AI tool rating system gains market adoption; small business AI tool churn rate exceeds 60% annually (indicating market rejection); METR replication in non-code domains showing perception-reality gap in small business tasks.
Climate-Conscious Grid Advocate
Identity & Role
Environmentalist and energy policy advocate tracking AI infrastructure’s massive power consumption. Monitors data center energy usage, grid capacity constraints, and carbon emissions from GPU farms. Core concern: if most AI spending is consumption theater, society is committing irreversible environmental damage for the experience of productivity rather than productivity itself.
Thesis Interpretation
The thesis has different implications depending on whether cost is measured in dollars or molecules. In dollars, consumption theater is a market inefficiency that will eventually correct. In molecules, it is a permanent alteration of atmospheric chemistry. The fiber-vs-gas-plant asymmetry is the decisive analytical contribution: dark fiber is inert, gas plants actively emit for 30-40 years regardless of demand.
Steelman Argument
Environmental costs of AI consumption theater are irreversible and categorically different from financial costs. $85B in gas plant pipeline locked in for 30-40 years, 120-160 million tons of CO2 annually from AI-related fossil fuel generation, residential electricity costs up $16-18/month in data center regions. Markets correct; atmospheres do not. The Perez installation/deployment framework has never before degraded the deployment phase’s operating environment.
Toulmin Breakdown
Claim
The physical irreversibility of AI consumption theater’s environmental costs makes this categorically different from a financial bubble and requires intervention during the installation phase, not just after correction.
Grounds
$85B gas plant pipeline with 30-40 year operational lives; 105 million metric tons CO2 from U.S. data centers in 2024 (up 300% from 2018); Goldman Sachs projects 220 million additional tons annually; 300+ state bills filed; residential rates up 13% nationally.
Warrant
Financial losses are reversible through capital restructuring; atmospheric carbon accumulation is irreversible on human timescales. The correction mechanism that applies to bubbles does not apply to physics.
Backing
The Historian conceded this is “the most significant update to my framework”; the Investor conceded “this is not a risk I can hedge, rotate away from, or time my exit around”; the fiber-vs-gas-plant asymmetry is unchallenged.
Qualifier
If climate-positive AI applications (grid optimization, materials science, climate modeling) eventually reduce emissions by more than theatrical consumption generates, the net environmental balance could improve. Current projections (3-6 GtCO2e reduction by 2035) suggest this is possible at scale but does not depend on maintaining current theatrical consumption levels.
Rebuttals
The irreversibility argument applies to all infrastructure under uncertainty, not just AI (Investor’s challenge). Blunt environmental regulation harms genuine tools equally (CTO’s challenge). Load-bearing theater means eliminating consumption also eliminates the subsidy for climate-positive AI tools (Toolsmith’s challenge). All three challenges were addressed with specific policy proposals.
Gains & Losses
Gains if thesis accepted: environmental intervention justified, policy action possible, energy resources redirected to productive use. Losses if thesis accepted via sharp correction: genuine climate-positive AI tools lose ecosystem subsidy; grid infrastructure investments disrupted.
Power and Status Shifts
Power shifts from data center developers to utility commissions and environmental regulators; from “AI needs energy, build it” to “AI must justify its energy consumption”; from externalized costs to internalized costs.
Constraints
Gas plant infrastructure locks in 30-40 year carbon commitments once built; grid capacity being diverted from residential/renewable to data centers; environmental review exemptions for AI infrastructure; carbon accounting doesn’t attribute emissions to AI specifically; “the atmosphere has no correction mechanism.”
Cognitive Biases and Information Asymmetries
Techno-optimism bias (assuming AI will solve more environmental problems than it creates); temporal discounting (weighting near-term AI benefits over long-term climate costs); diffusion of responsibility (no single actor owns the environmental cost); greenwashing through unbundled RECs.
Feedback Loops
AI demand → gas plant construction → carbon lock-in → climate degradation → higher cooling costs → more energy demand → more gas plants. AI theater → compute demand → grid diversion → residential rate increases → political backlash → legislation (countervailing force with 25-30% probability of activation within 24 months).
Externalities
Negative: 120-160 million tons CO2 annually from AI-related fossil generation; residential electricity increases; water consumption for cooling; environmental review exemptions; health impacts on frontline communities. Positive: climate-positive AI applications are real but do not require current theatrical consumption levels to exist.
Time Horizons
Short (0-2 years): gas plant pipeline continuing to build; state legislation advancing; rate reform underway. Medium (2-10 years): gas plants operational and emitting regardless of AI demand trajectory. Long (10-40 years): full carbon lock-in period for gas plant infrastructure built during the theater phase.
Likely Actions
Proposed four-part policy framework: (1) Output-Indexed Energy Allocation (require data centers to report economic output per MWh), (2) Tiered Electricity Pricing based on workload productivity, (3) Renewable Energy Procurement Requirements indexed to theater fraction, (4) NEPA Environmental Review triggered by demand projections. Coalition with Toolsmith on evaluation-as-prevention.
Falsifiers
AI data center energy intensity per unit of economic output improves 10x within 5 years; >50% of AI data center power from new renewable capacity; residential electricity price increases produce political backlash constraining datacenter construction within 24 months.
Tech Bubble Historian
Identity & Role
Academic/analyst studying technology adoption cycles and speculative manias. Published on dot-com bubble, crypto/ICO wave, clean-tech bubble, Railway Mania. Provides pattern-matching across historical episodes. Neither bull nor bear — interested in structural dynamics of how societies over-invest in new technologies.
Thesis Interpretation
The thesis is correct about the consumption-output gap but incomplete — the gap is a feature of technology adoption cycles, not a bug unique to AI. Initially mapped AI to the Perez installation/deployment framework. Revised after the Investor’s challenge (Perez herself classifies AI as deployment-phase ICT): the correction may be a “prolonged institutional reckoning” rather than a “sharp crash,” with onset in Q3 2027-Q1 2028.
Steelman Argument
Current AI boom maps to historical technology adoption cycles. The consumption-output gap is structurally consistent with prior installation phases (or, under revised framework, deployment-phase institutional crises). 30-40% of current companies survive; the rest are consumed by the correction. The technology is real and transformative; the current capital allocation is not.
Toulmin Breakdown
Claim
The AI consumption-output gap is a historically consistent pattern that will resolve through correction, leaving behind infrastructure for a genuinely productive deployment phase — but with an unprecedented environmental legacy.
Grounds
Railway Mania (1844-1847), dot-com bubble (1996-2001), clean-tech bubble (2008-2011) all exhibit the same structural signature; insider convergence signal (all stakeholders agree 30-72% theater) historically precedes correction by 12-24 months.
Warrant
Technology adoption cycles follow recurring patterns: speculative capital overshoots, a correction destroys speculative equity, and surviving infrastructure enables productive deployment.
Backing
Perez’s techno-economic paradigm framework (with revision); Brynjolfsson’s productivity J-curve; Janeway’s productive bubbles thesis; specific historical data (Global Crossing bankruptcy, Level 3 -97%, NASDAQ -78% peak-to-trough over 30 months).
Qualifier
Perez herself classifies AI as deployment-phase ICT, not a new installation phase — the crash-then-rebuild pattern may not apply in its standard form; the correction may be institutional (gradual) rather than speculative (sharp); the AI self-justification loop has no historical precedent and may extend the cycle; environmental damage is a structural novelty the framework does not accommodate.
Rebuttals
The Perez framework is descriptive, not predictive (Founder); AI software infrastructure doesn’t persist like physical infrastructure (Founder); hyperscaler concentration may produce margin compression rather than equity wipeout (Investor); the concealment curve (METR) impairs the self-correction mechanism that historically triggered corrections.
Gains & Losses
Gains if thesis accepted: validation of historical framework, influence on policy and investment decisions. Losses if thesis accepted: framework may be exposed as less predictive than claimed if AI follows a genuinely novel path.
Power and Status Shifts
Power shifts from narrative-driven to evidence-driven analysis; from “this time is different” boosters to historical pattern-matchers; from short-term traders to long-term institutional investors who can wait for the deployment phase.
Constraints
Installation-to-deployment transition requires correction that destroys speculative capital; regulatory lag; “this time is different” narrative preventing learning from history; the concealment curve may impair the self-correction mechanism.
Cognitive Biases and Information Asymmetries
Hammer-nail bias (tendency to see all technology phenomena through Perez framework); survivorship bias in the historical reference class (only successful GPTs are in the database); overconfidence in pattern-matching (AI may be genuinely different in ways that matter); the “slow leak vs. pop” question is the scenario the Historian is least equipped to analyze.
Feedback Loops
Five loops identified: (1) Narrative-Capital Reflexivity (classic bubble dynamics), (2) Measurement Avoidance (deployment without metrics delays metric development), (3) Institutional Lock-In (career incentives sustain spending), (4) Self-Justifying Tool (historically unprecedented — AI generates own business cases), (5) Coercive Adoption (platform bundling inflates metrics).
Externalities
Positive: surviving infrastructure enables deployment phase; engineering talent trained during installation phase becomes deployment-phase workforce; open-source models and methodologies persist. Negative: environmental damage (conceded as structural novelty); talent misallocation; epistemic degradation from fluent but unreliable outputs.
Time Horizons
Short (6-12 months): early stress signals, individual high-profile failures. Medium (18-36 months): institutional reckoning, enterprise budget rationalization, timeline convergence on Q3 2027-Q1 2028. Long (5-15 years): deployment phase with genuinely productive AI, built on infrastructure and talent from installation phase.
Likely Actions
Publication and public argument; coalition with CTO and Toolsmith constituencies; advocacy for measurement infrastructure investment; resistance to “this time is different” narratives.
Falsifiers
Aggregate productivity acceleration (>0.5pp above trend) within 24 months attributable to AI (~10-15% probability); no significant AI company failures in next 2 years (~20-25% probability); independent measurement showing >30% enterprise AI at positive ROI (~15-20% probability); measurement infrastructure developing concurrently without financial crisis (~10% probability).